Docker Swarm & Logging
In the previous exercise we saw how to check out logs for running containers on a single host. In this section we’ll be creating services across a Swarm and shipping those logs to a centralized location for easier storage and querying.
Tasks:
Task 1: Setup the logging stack
For this exercise we’re going to use the popular ELK logging stack:
- ElasticSearch (for storing and indexing large datasets)
- Logstash (for ingesting raw logs and optionally transforming them before sending them to ElasticSearch)
- Kibana (a web UI for querying into ElasticSearch)
-
Change to the Manager Node
-
To get started, let’s run the following in our terminal:
 git clone https://github.com/deviantony/docker-elk.git

 Cloning into 'docker-elk'...
 remote: Counting objects: 1238, done.
 remote: Compressing objects: 100% (3/3), done.
 remote: Total 1238 (delta 0), reused 1 (delta 0), pack-reused 1235
 Receiving objects: 100% (1238/1238), 260.98 KiB | 7.68 MiB/s, done.
 Resolving deltas: 100% (468/468), done.
Note: The ELK stack we’re using here is a Dockerized version created by Anthony Lapenna
-
Move into the
docker-elkdirectory and switch to thedocker-stackbranch.cd docker-elk/ ls LICENSE README.md docker-stack.yml elasticsearch extensions kibana
Deploy the ELK stack file to the Swarm
Docker Desktop Users: Before continuing, check your Docker for Desktop preferences -> Kubernetes If “Deploy Docker Stacks to Kubernetes by default” is checked, uncheck. If left checked, the following command will fail.
-
Now we have the stack downloaded, we can deploy it to the Swarm.
 docker stack deploy -c docker-stack.yml elk

 Creating network elk_elk
 Creating config elk_elastic_config
 Creating config elk_kibana_config
 Creating service elk_logstash
 Creating service elk_kibana
 Creating service elk_elasticsearch
We can see that Docker created a lot of components on our Swarm.
network elk_elk: a new overlay network so that our services can talk to each otherconfig elk_elastic_config: configuration for ElasticSearchconfig elk_kibana_config: configuration for Kibanaservice elk_logstash: service for Logstashservice elk_kibana: service for Kibanaservice elk_elasticsearch: service for ElasticSearch
-
Let’s
watchthedocker service lscommand to make sure they all start without any errors:watch docker service ls Every 2s: docker service ls 2018-06-12 16:18:31 ID NAME MODE REPLICAS IMAGE PORTS q3qpjimjsom3 elk_elasticsearch replicated 0/1 docker.elastic.co/elasticsearch/elasticsearch-oss:6.2.2 *:9200->9200/tcp,*:9300->9300/tcp 77hwcyksqdne elk_kibana replicated 0/1 docker.elastic.co/kibana/kibana-oss:6.2.2 *:5601->5601/tcp 8sbocpf7462e elk_logstash replicated 0/1 docker.elastic.co/logstash/logstash-oss:6.2.2 *:12201->12201/udp -
Once the services have all converged, let’s check that we can access the Kibana web UI.
PWD If you’re using PWD then open UCP -> Swarm -> Services -> elk_kibana. Open the endpoint URL in a browser tab.
Deployed locally
If you deployed to a local cluster, you should visit the IP of one of your nodes on port 5601 or just http://localhost:5601
- user: elastic
- password: changeme
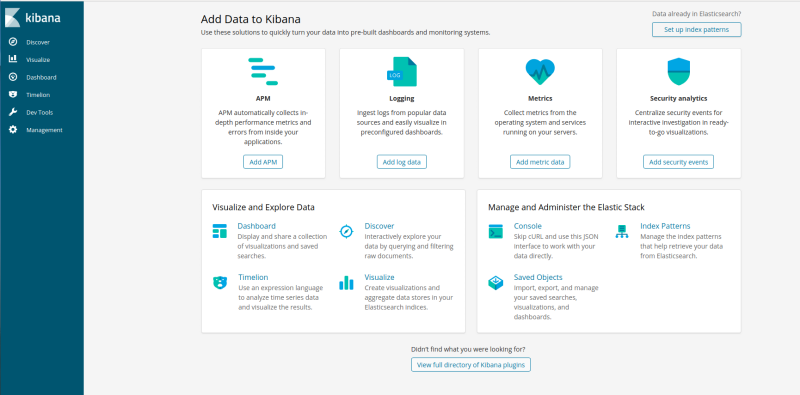
You should see the Kibana dashboard appear.
Task 2: Configure services to log centrally
Now that we have our logging infrastructure setup, let’s create a service that will send logs over to it.
-
We have deployed Logstash and exposed port 12201 as an ingress port, which means we can hit any IP in our cluster on that port to send traffic to Logstash, regardless if it’s running on that host or not. Let’s grab the IP of the host we’re on and use that.
# Play-with-Docker users LOGSTASH=localhost # Mac users LOGSTASH=0.0.0.0 -
Now let’s start a new test service and pass some logging options so that Docker knows to ship our logs to Logstash.
  docker service create \
     --name logging-test1 \
     --mode global \
     --log-driver=gelf \
     --log-opt gelf-address=udp://${LOGSTASH}:12201 \
     --log-opt tag="LogTest1 - /" \
     alpine \
     ping google.com

 mhfj8gujc0ynej6u8ybo3car9
 overall progress: 5 out of 5 tasks
 kw9vz2dve3t9: running   [==================================================>]
 0cjj9gwlbjkh: running   [==================================================>]
 oy0quc1fh770: running   [==================================================>]
 4mrklhm2r3vh: running   [==================================================>]
 vu1dusztugvu: running   [==================================================>]
 verify: Service converged
Let’s run through some of the options here:
--name logging-test1: name of the service--mode global: one container per Swarm host--log-driver=gelf: we’re going to use the GELF (Graylog Extended Log Format) driver--log-opt gelf-address=udp://${LOGSTASH}:12201: telling Docker where to send our GELF-formatted logs--log-opt tag="LogTest1 - /": adding a tag to our service for easier querying lateralpine: the image we want to runping google.com: the command our service is going to run
Notes:
-
Check the service is up:
  docker service ps logging-test1
 ID                  NAME                                      IMAGE               NODE                DESIRED STATE       CURRENT STATE           ERROR          PORTS
 d9z4jarhh0bd        logging-test1.4mrklhm2r3vhoa6be3e47r50j   alpine:latest       manager1            Running             Running 3 minutes ago
 6k6rlloh8rk9        logging-test1.kw9vz2dve3t9hz06rrrvun9uf   alpine:latest       manager2            Running             Running 3 minutes ago
 xc5210kz8d6x        logging-test1.vu1dusztugvumrbu3bt3wnqtx   alpine:latest       worker1             Running             Running 3 minutes ago
 a7p9pz88vgb3        logging-test1.0cjj9gwlbjkhev9m5ypu9hcl6   alpine:latest       manager3            Running             Running 3 minutes ago
 crzpzqp93vcr        logging-test1.oy0quc1fh770f3phjd2dlir5y   alpine:latest       worker2             Running             Running 3 minutes ago
Task 3: Querying Logs in Kibana
Now that we have our ELK stack setup, and a service logging to it, let’s look in Kibana and review the logs.
-
Before we can query logs in Kibana, we need to setup the index. This is pretty straightforward as long as we have some data in our ElasticSearch instance (which by now we should do!).
-
Open your Kibana tab (or re-open it if you closed it after we verified it was up earlier, it should be on port
5601). -
Click on the ‘Setup Index Patterns’ button on the top-right’.
- Enter
logstash-*as the pattern and hit ‘Next Step’.
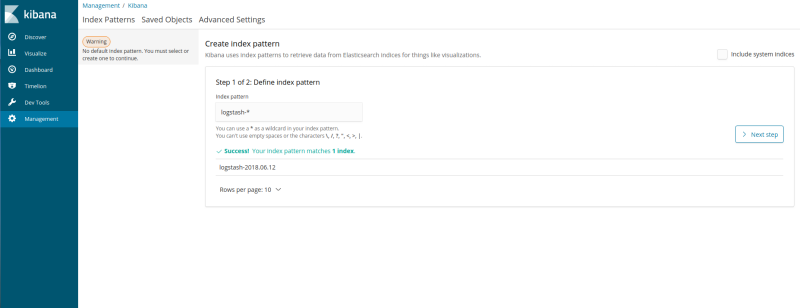
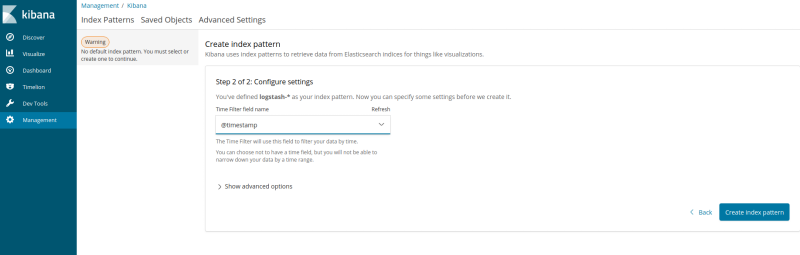
- Select
@timestampfrom the drop-down and choose ‘Create Index Pattern’.
- Click ‘Discover’ on the left-hand menu bar.
-
-
You should now be looking at the main querying interface of Kibana. Let’s add some fields to make the viewing pane a little cleaner.
Hover over the message field on the left-hand field list, and hit the add button. Repeat for the container_name and tag fields.
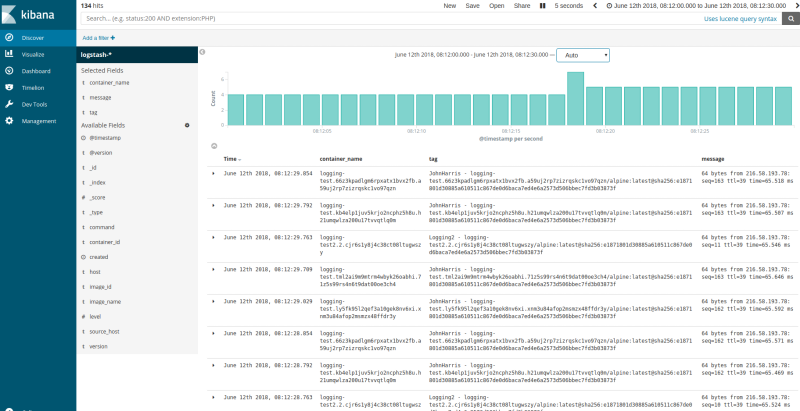
- We can see that Kibana shows us all the log messages (ping output) from every container in our Swarm, including some additional metadata.
Let’s filter on everything from a specific host.
-
Click on the
source_hostfield in the left-hand field list and remember one of the host IP addresses. -
Above the field list, click the
Add Filterbutton and then choosesource_hostas the field,isas the operator, and type your chosen IP into theValuefield. -
The output should change and you will see only logs from that host.
-
Now let’s run another service so we can query on the tag field.
-
Back on one of your manager nodes, run the following:
docker service create \ --name logging-test2 \ --mode global \ --log-driver=gelf \ --log-opt gelf-address=udp://${LOGSTASH}:12201 \ --log-opt tag="LogTest2 - /" \ alpine \ ping facebook.com l7spcatz359qqehuj2sd0rddm overall progress: 1 out of 1 tasks 1/1: running [==================================================>] verify: Service converged- Once the service has converged head back to Kibana.
- Let’s also query on the contents of the
tagfield.
In the search bar at the top of the UI, enter the following query:
tag: LogTest2*
You should see the list of logs update to show only those from your new service.
- Feel free to play around with other services and tags, and construct different queries in the Kibana UI. Documentation on the Lucene syntax that ElasticSearch and Kibana use for querying can be found here.
Task 4: Create a Dashboard
In this section we will create a simple dashboard based on the ping data we are receiving.
- Click
Visualizeon the left-hand menu bar. - Click “Create new Visualization”
- Select the Data -> Metric visualization
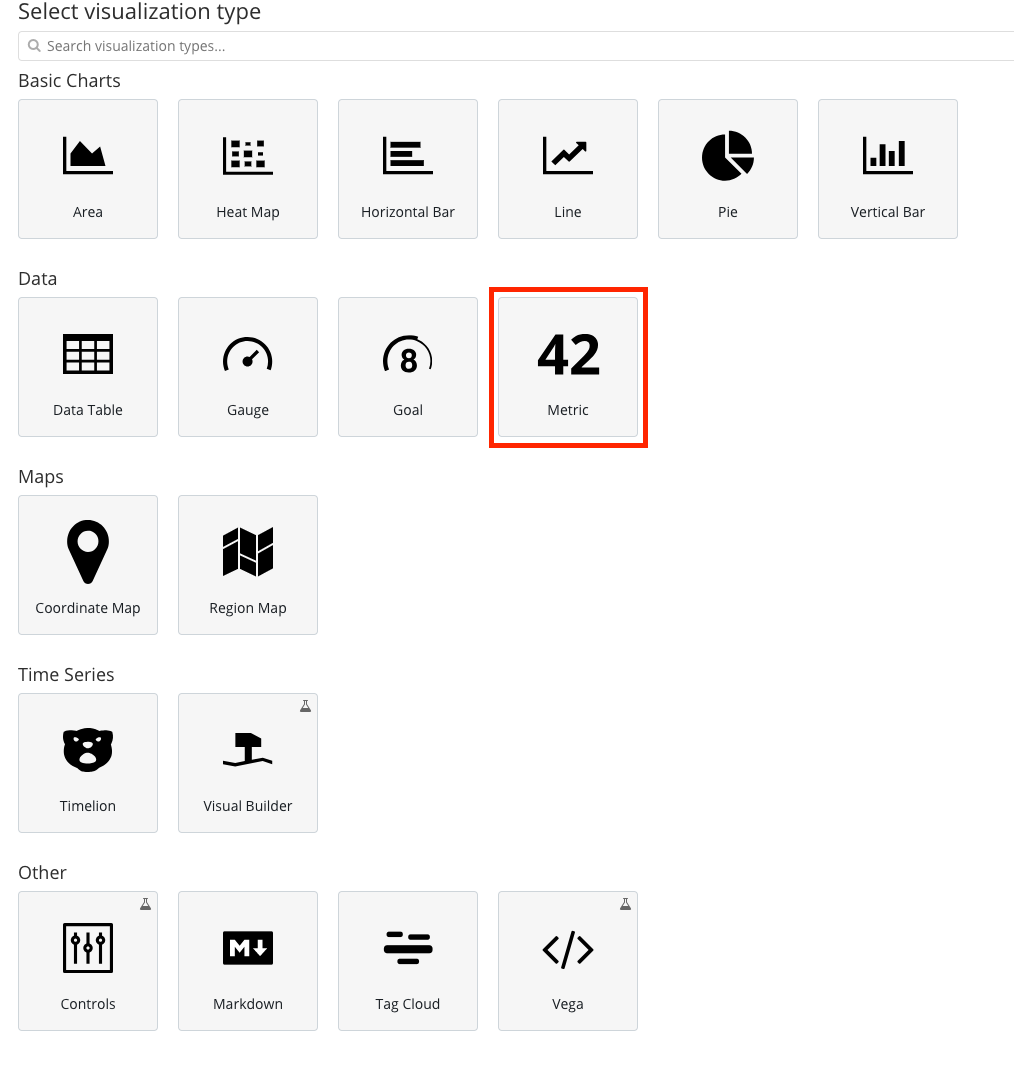
- On the left-hand menu select ‘Count’ as the aggregation type and fill in the custom label to name your visualization.
- Upper right hand of the ELK screen on the menu bar, select Save.
- Type in a name of the visualization
Next, we will create a pie graph
- Click
Visualizeon the left-hand menu bar. - Click “Create new Visualization” this time it is ‘+’ symbol
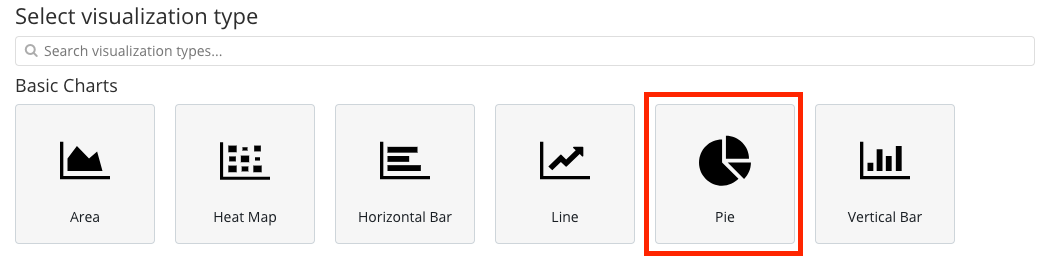
- Select the Basic charts -> Pie visualization
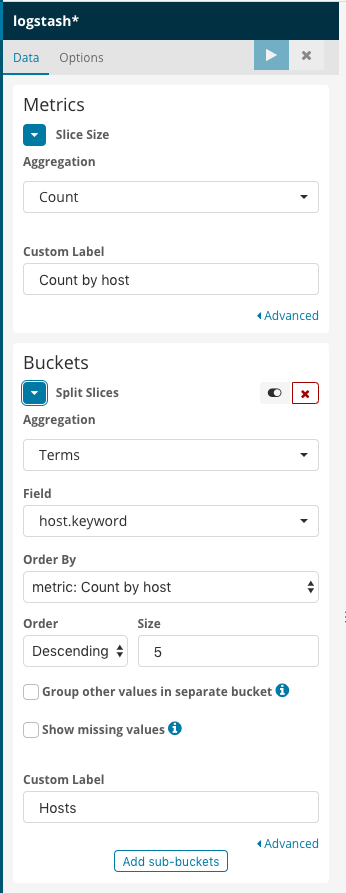
- On the left-hand menu select
Countas the aggregation type and fill in the custom label to name your visualization. - Expand the Buckets section
- Select
Countas the aggregation type - Bucket -> Split Splices
- Aggregation Type -> Term
- Field -> host.keyword
- Order by -> metric: Count by host
- Order -> Decending -> 5
- Custom Label -> Hosts
- Upper right hand of the ELK screen on the menu bar, select Save.
- Type in a name of the visualization
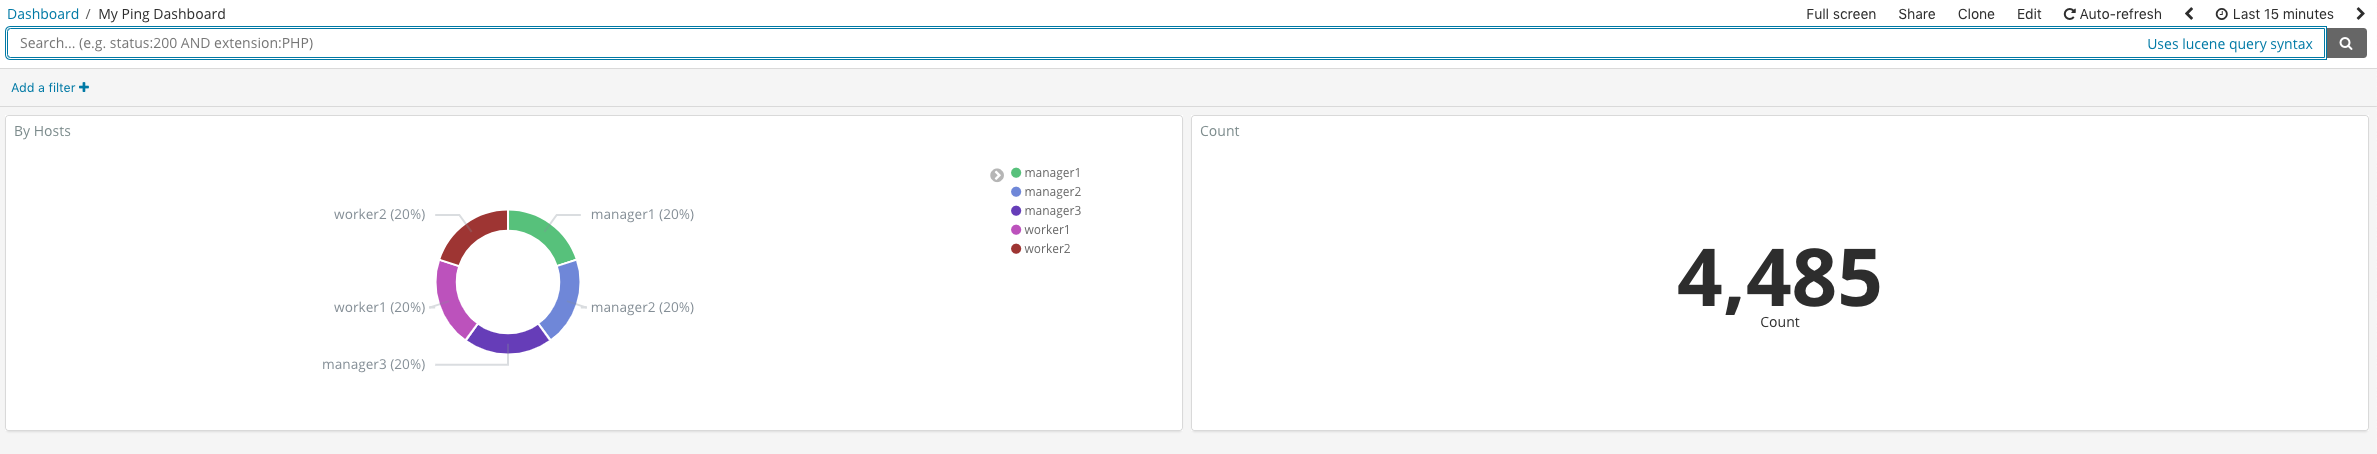
Finally, put the two new visualizations in a Dashboard
- Click ‘Dashboard’ on the left-hand menu bar.
- Click ‘Add’ button either in the middle of the screen or upper right hand corner menu
- Click the names of the two visualizations that we named earlier.
Clean Up
Remove the ELK Swarm Stack and running services
  docker service rm logging-test1 logging-test2
  docker stack rm elk
Recap
What did we learn in this section?
- Setting up an ELK stack in our Swarm cluster
- Configuring Docker services to ship logs to our central ELK stack
- Filtering and querying on logs in Kibana
- Create a simple dashboard
Next Steps
For the next step in the tutorial, head over to the Docker Monitoring section.